
Image Source Pixabay
200+ Email Marketing Facts
Do you want to know more facts and statistics on Email Marketing? If Yes, then you are at right place 🙂 . Here are more than 200 plus email marketing facts that you should know before creating email campaign for your business. I made below sections:
-
- General
- B2B Email Marketing Statistics
- Mobile Email Marketing Statistics
- B2C Email Marketing Statistics
- Embed video in an email
- Click through Rate
- Email Marketing ROI
- Email Usage
- Inbox Structure and Email Marketing Statistics
- Spam & Segmentation Statistics
- Email sending automation
- Segmentation and personalization
- Email frequency and timing
- Subject line, email body, and sign-offs
- Picture in email em15″General Facts
General
- There are 3.9 billion daily email users
- Mobile opens account for 46 percent of all email opens
- 35% of business professionals check email on a mobile device.
- 73% of millennials prefer communications from businesses to come via email.
- Marketers who use segmented campaigns note as much as a 760% increase in revenue.
- 35% of marketers send their customers 3-5 emails per week.
- 78% of marketers have seen an increase in email engagement over the last 12 months
- 80% of business professionals believe that email marketing increases customer retention.
- 59% of respondents say marketing emails influence their purchase decisions.
- Marketers who use segmented campaigns note as much as a 760% increase in revenue.
- There are 3.9 billion daily email users. This number is expected to climb to 4.3 billion by 2023. (Statista, 2020)
- Active email accounts surpassed 5.6 billion in 2019. (Statista, 2019)
- 35% of marketers send their customers 3-5 emails per week.
- 31% of B2B marketers say email newsletters are the best way to nurture leads. (Content Marketing Institute, 2020)
- The U.S. spent over 350 million dollars on email advertising in 2019. (Statista, 2019)
- The number of email users worldwide is forecasted to rise to 2.9 billion by 2019.
- The number of email users in the US was projected to grow to 244.5 million by the end of 2017, and 254.7 million by 2020.
- Nearly 105 billion emails are sent each day; this number is expected to reach 246 billion before 2020.
- The use of emoji in email marketing messages increased 775% from 2015 to 2016.
- The percentage of emails containing GIFs rose from 5.4% in 2015 to 10.3% in 2016.
- 21% of sent emails are opened within the first hour of delivery.
- Email marketing boasts a 4200% ROI ($42 for every $1 spent).
- 59% of B2B marketers prefer email for lead generation.
- Email is 40% better at converting (in comparison to Facebook and Twitter).
- 40% of B2B marketers claim that email newsletters are the most important tactic in their content marketing strategy.
- 37% of respondents name email as the most effective channel for customer loyalty and retention, while websites were named by 13% and social media by only 11%.
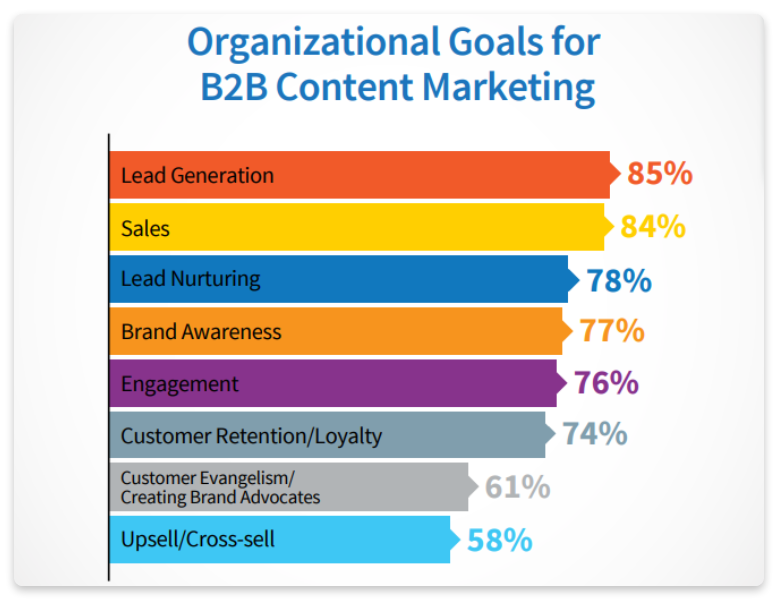
Marketing and advertising emails influence the buying decision of 50.7% of customers. - Email marketing is mostly used for lead generation (85%), sales (84%), lead nurturing (78%), and customer retention (74%).
B2B Email Marketing Statistics
- 81% of B2B marketers say their most used form of content marketing is email newsletters. (Content Marketing Institute, 2020)
- 16% of all emails never make it into the inbox. (Email Tool Tester, 2019)
- 87% of B2B marketers say email is one of their top free organic distribution channels. (Content Marketing Institute, 2020)
- 90% of content marketers say email engagement is the top metric they track to measure content performance. (Content Marketing Institute, 2020)
- The second-most common technology B2B organizations use to assist with content marketing is mail marketing software. Roughly 85% of marketers say they work with these tools. (Content Marketing Institute, 2020)
- Email is the third most influential source of information for B2B audiences, behind only colleague recommendations and industry-specific thought leaders.
- 86% of business professionals prefer to use email when communicating for business purposes.
- CTRs are 47% higher for B2B email campaigns than B2C email campaigns.
- 59% of B2B marketers say email is their most effective channel in terms of revenue generation.
- 56 percent of brands using emoji in their email subject lines had a higher open rate, according to a report by Experian.
- Tuesday is the best day of the week to send email (according to 10 email marketing studies).
- 83 percent of marketers use email newsletters for content marketing. (Source)
- Optimizing for mobile had a positive impact on the results of email campaigns for 40.74 percent of B2B marketers and 38.46 percent of B2C. (Source)
- Seventy-nine percent of B2B marketers credit email as the most effective distribution channel for demand gen efforts. (Source)
- Clickthrough rates are 47 percent higher for B2B email campaigns than B2C email campaigns. (Source)
- As far as content marketing tool usage, 64 percent of B2B marketers use a dedicated email platform to reach audiences. (Source)
- 93 percent of B2B marketers use email to distribute content. (Source)
- 91 percent of B2B marketers rate email as important to overall content marketing success. (Source)
- Email is the third most influential source of information for B2B audiences, behind only colleague recommendations and industry-specific thought leaders. (Source)
- Forty-nine percent of B2B marketers spend more resources on email than other channels. (Source)
- Subject lines that contain “money,” “revenue,” and “profit” performed best for B2B companies. (Source)
Mobile Email Marketing Statistics
- Mobile opens accounted for 46 percent of all email opens. (Litmus.com, 2018)
- 35% of business professionals check email on a mobile device. (Convince & Convert, 2018)
- Apple iPhone is the most popular mobile client for reading emails with 29 percent of all opens occurring on this platform. Gmail is a close runner-up at 27 percent (Campaign Monitor, 2018)
- Mobile-friendly email is the second most-used tactic email marketers to improve their performance. (HubSpot, 2020)
- Mobile accounted for 42% of all email opens in 2019. (Litmus, 2019)
- 40% of people 18 years old and under will always open an email on their mobile device first. (Campaign Monitor, 2019)
- Apple iPhone and Gmail are the most popular clients for opening mobile emails. (Campaign Monitor, 2019)
- Mobile readers who open emails a second time from their computer are 65% more likely to click through. (Campaign Monitor, 2019)
- Nearly 25% of people who open an email on a mobile device will open it again: 70% will stick with their mobile device, and 30% will go elsewhere. (Campaign Monitor, 2019)
- 40% of consumers say they have at least 50 unread emails in their inbox. (Sinch, 2020)
- Out of all email opens, mobile opens accounted for 46% of them.
- According to TechCrunch, Google reported that 75% of all Gmail users access their email account through a mobile device.
- Out of every 3 clicks on links within emails, one of them is through a registered mobile device.
- 23% of consumers who click on an email on a mobile device will open the same email again later.
- If a consumer reads an email on his mobile device, then read it again on a desktop, there’s a 65% higher chance for clicking through the email.
B2C Email Marketing Statistics
- 80% of business professionals believe that email marketing increases customer retention. (Emarsys, 2018)
- 59% of respondents say marketing emails influence their purchase decisions. (SaleCycle, 2018)
- The most opened emails relate to hobbies, with an open rate of 27.35 percent. (MailChimp, 2018)
- 59% of marketers say email is their biggest source of ROI. (Emma, 2018)
- While 26% of SMBs polled use email marketing for sales, just 7% use email as a brand-building tool.
- Only about 30% of US retail email list subscribers have actually made a purchase from the retailer whose email list they subscribed to.
- Welcome emails are incredibly effective: on average, 320% more revenue is attributed to them on a per email basis than other promotional emails.
- Consumers who purchase products through email spend 138% more than those that don’t receive email offers.
- Email subscribers are 3x more likely to share content on social media than leads who came through another channel, according to QuickSprout.
- 80% of retail professionals indicate that email marketing is their greatest driver of customer retention (the next closest channel? Social media, identified by just 44% of those same professionals).
- 77% of people prefer to get permission-based promotional messages via email (versus direct mail, text, phone, or social media).
Embed video in an email
- An initial email with a video receives a CTR increase of 96%.
- 81% of marketers use video as a marketing tool.
- 78% of marketers using video say that it increases ROI.
- Attaching a video in an email can lead to a 200-300% increase in CTR.
- Using the word “video” increases open rates by 19%, CTR by 65%, and cuts the number of unsubscribes by 26%.
- 54% of email subscribers prefer emails with videos.
- People mostly watch videos on a desktop (84%) while only 14% watch it on mobile devices.
- 90% of users say that videos help them make a purchase decision.
Click through Rate
- Message Personalization is the number one tactic used by email marketers to improve performance. (HubSpot, 2020)
- 35% of marketers choose to send three-to-five emails per week to their customers. (HubSpot, 2020)
- Promotional emails are the most common email type that marketers are investing in. (HubSpot, 2020)
- The industry average email click-through rate is 2.13%. (GetResponse, 2020)
- Hobbies have the highest click rate, at 5.01% (Mailchimp, 2019)
- Friday is typically the day with highest click-through rates potential, at 2.7%. (Campaign Monitor, 2020)
- At 30.5% in 2020, government emails dominate email open rates globally. (Campaign Monitor, 2020)
- Brands and companies with the highest open rates are those who send 2 emails per month.
- Although 67% of consumers say they prefer image-based and HTML emails, plain-text emails get higher open and click-through rates.
- Emails with the highest open rates are those who are related to governments, hobbies, and artists.
- On average, personalized email campaigns improve the rate of click-throughs by 14%.
- Adding a specialized call-to-action button at the end of your email instead of text links increases the chance of click-throughs by 28%.
Email Marketing ROI
- Email has an average ROI of $38 for each dollar spent. (Source)
- One in five companies reports an ROI of 70:1. (Source)
- Email is three times more likely to prompt purchases than social media. (Source)
- The average order value of email is 17 percent higher than social media. (Source)
- The ROI of email is 28.5 percent and is only seven percent for direct mail. (Source)
- It’s estimated that the U.S. will spend over $350 million on email advertising in 2019. (Source)
- More than 59 percent of marketers say email is their biggest source of ROI. (Source)
- 60 percent of marketers use conversion rates to evaluate the effectiveness of email campaigns. (Source)
- 29 percent of marketers use ROI to evaluate the effectiveness of email campaigns. (Source)
- 81 percent of SMBs rely on email as their primary customer acquisition channel. (Source)
Email Usage
- Roughly 80% of marketers have reported an increase in email engagement over the past 12 months. (HubSpot, 2020)
- In 2019, the number of global email users amounted to 3.9 billion. (Statista, 2019)
- The number of global email users is set to grow to 4.48 billion users by 2024. (Statista, 2019)
- From a study of 1,000 small business owners, email marketing was ranked as the second most effective medium for building brand awareness. (Campaign Monitor, 2019)
- Email marketing has the highest return on investment for small businesses. (Campaign Monitor, 2019)
- Tuesdays see the highest email open and email unsubscribe rates. (Campaign Monitor, 2019)
- The average email deliverability across all email service providers is 79.6%. (EmailToolTester, 2019)
- In the U.S., 21% of email opens happens between 9 a.m. and noon. (Litmus, 2019)
- The number of global e-mail users is set to grow to 4.48 billion users in 2024. (Statista, 2020)
Inbox Structure and Email Marketing Statistics
- Out of all emails sent by marketers, only 16% of them make it to the inbox tab.
- Some words have been found to have a negative impact on open rates when used in the subject line. The words “help,” “free,” “reminder,” and “% off discount” were among these words.
- The first 30 characters in the subject line are the most crucial, as they’re the only visible characters in Apple’s iPhone email app.
- The average subject line contained 43.85 characters.
- Only 6.9% of all emails’ subject lines contain an emoji.
- Out of the 1,000 emails that Aweber analyzed, they found that most emails had 434.48 words on average. This number of words takes about 3.3 minutes to read.
- 82% of marketers send emails with subject lines of 60 characters or less.
- Out of the 1,000 emails that Aweber analyzed, 24.1% of the emails contained 600 words or more. However, only 11.4% contained more than 901 words.
Spam & Segmentation Statistics
- 49% of digital marketers indicate that the Canadian Anti-Spam Law (CASL) has had no discernable impact on their company’s email marketing program.
- The average number of legitimate business emails received each day has remained static since 2015, but the number of spam emails that bypass security filters (spam that actually hits your inbox) has risen from 12 emails per day in 2015 to 16 emails per day in 2017.
- Nonprofits lose about $15k/year in donations due to spam filters blocking fundraising campaign emails from prospects’ inboxes.
- Segmented email campaigns have an open rate that is 14.32% higher than non-segmented campaigns.
- Click-throughs are 100.95% higher in segmented email campaigns than non-segmented campaigns.
- Every day, 14.5 billion spam emails are sent to consumers.
- 45% of all the emails sent are considered spam emails.
- According to Chris Murphy from LinkedIn, the safest way to avoid getting your mail in the spam folder is by sending mail to subscribers only.
- Unless you send your mail to those who’ve opened one of your emails in the last 6 months, the mail will end up in the spam folder.
- Out of 12.5 million spam emails sent, only one email will ever get a response.

Email sending automation
- On average, 51% of companies are currently using automation.
- 64% of B2B respondents say that they use email automation techniques.
- The biggest marketing automation benefits are:
- saving time (30%)
- lead generation (22%)
- higher revenue (17%)
- customer retention (11%)
- monitoring marketing campaigns (8%)
- shortening the sales cycle (2%)
- 47% of marketers are sure that automation is worth the price.
- 68.5% of responders believe that automation improved the targeting of messages.
- Triggered emails result in 8 times more opens and greater earnings than typical bulk emails.
- The average unsubscribe and spam rates of triggered emails are 0.58% and 0.06% respectively.
- The best tactics for automation are mapping the customer experience (53%) and use of personalized messages (51%).
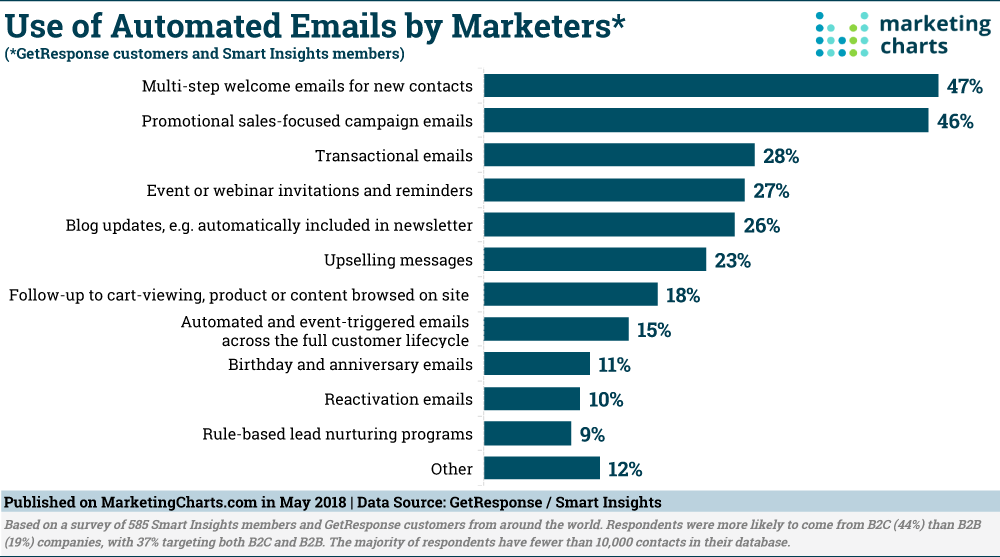
- Automation tools are used for sending all types of emails:
- welcome emails (47%)
- promotional sales emails (46%)
- transactional emails (28%)
- invitations and reminders (27%)
- blog updates (26%)
- upselling emails (23%)
- event-triggered emails based on customer lifecycle (15%), etc.
- Average open rate of triggered email campaigns is 46%, CTR – 11%, and click-to-open rate – 24%.
- The average open rate of a “Welcome email,” is 82 percent. (Source)
- Sending 3 abandoned cart emails results in 69 percent more orders than a single email. (Source)
- Automated email campaigns account for 21 percent of marketing revenue. (Source)
- Over 75 percent of email revenue is generated by triggered campaigns. (Source)
Companies that send automated emails are 133 percent more likely to send relevant messages that correspond with a customer’s purchase cycle. (Source) - On average, more than 51 percent of companies are currently using marketing automation. (Source)
- More than half of B2B companies plan to adopt marketing automation technology. (Source)
- Email marketing technology has the highest adoption. (Source)
- 33 percent of marketing campaigns are automated. (Source)
- Automated emails get 119 percent higher click rates than broadcast emails. (Source)
Segmentation and personalization
- Email list segmentation and personalization were the most effective email strategies in 2017.
- Segmented email campaigns show 50% higher CTR than untargeted campaigns.
- The top 3 reasons for using personalization in email marketing are improved open rate (82%), higher CTR (75%), and better customer satisfaction (58%).
- Top 3 email marketing tactics are: list segmentation (51%), personalization (50%), and triggered emails (45%).
- During a SuperOffice email marketing experiment, a segmented email campaign earned a 94% open rate and a 38% CTR, versus 42% open rate and 4.5% CTR in a non-segmented email campaign.
- Marketers who send segmented campaigns notice a 760% increase in revenue.
- 88% of users agree they are more likely to respond to an email favorably if it looks like it’s been specifically created for them.
- 62% of emails are opened thanks to a personalized subject line.
- By addressing the recipient by their name, you can increase open rates and CTR up to 35%.
- 10% of respondents are annoyed by too little or no personalization.
- According to the respondents, the most frustrating things about personalization are: recommending items that don’t match their interests (34%), expired offers (24%), name misspelling (15%), inappropriate season or location offer (14%), already purchased promotions (13%).
- Only 4% of marketers use highly-personalized targeting, 13% use segmentation for different audiences, 31% claim that they use basic segmentation (2-5 criteria), and 53% do not target at all.
- 58% of revenue is generated thanks to segmented and personalized emails.
- 62% of marketers say that personalization is the most effective technique.
- Segmented email campaigns open rates increased by 39%; revenue, deliverability, and sales leads all increased by 24%, transactions – 18%
Email frequency and timing
- 61% of subscribers/customers would like to receive promotional emails every week, 38% – more frequently.
- Marketers get in touch with their clients (per month): 2-3 times (32%), 4-6 times (19%), once (17%), 6+ times (16%).
- 28% of subscribers state they’d like to see promo offers twice or even thrice a week.
- 18% of emails are sent on Thursdays, 17% on Tuesdays, 16% on Wednesdays.
- The worst open and click-through rates are on weekends.
- 11AM is the best time for sending emails, 12AM shows the highest CTR.
- Traffic peak is in autumn and winter (especially on Black Friday, Cyber Monday and December 23).
- 50% of marketers claim that there is no perfect time for sending email campaigns as every person and business is unique.
- The best days for emails are Tuesday and Thursday.
Subject line, email body, and sign-offs
- 47% of people open the emails based on the subject line and 69% of customers can report emails as spam based on the subject line only.
- In one study, emails without subject lines were so intriguing they yielded an 8% higher open rate.
- Welcome emails bring 320% more revenue per email than other promo emails.
- Open rate by the number of words in the subject line:
- 6-10 words (21%)
- 0-5 words (16%)
- 11-15 words (14%)
- 16-20 words (12%)
- Emails with “fw:” in the subject line are 17% less likely to be opened.
- Emails containing personalization in the subject line are 22% more likely to be opened.
- The email subject line most often contains:
- the customer’s name (46.21%)
- the product name/details (44.01%)
- the company name (42.88%).
- At the same time, these three variables in the email subject line show the highest conversion rate (3.71%, 3.18%, and 3.58% respectively).
- Emails with active discount codes have an 8 times higher chance to make a sale than those without any discounts.
- An average marketing email consists of 434.48 words and it takes 3.3 minutes to read.
- Most (19% of subscribers) respond to the messages of 200-250 words, 17% to those under 50 words, 15% – to 150-200 words long email.
- iPhone cuts off the subject lines over 32 characters.
- 52% of managers add signatures into their emails.
- Emails with signatures with a photo receive 32% more replies than emails without it.
- 7 lines is the perfect size for an email signature (75% of senders include contact info, 60% add a phone number, less attach Twitter (7%), Facebook (3%), or LinkedIn (2%).
- 17% of adults are using a formal style for email communication, 33% prefer informal style, 49% say it depends.
- The most popular sign-offs are:
- Thanks (62%)
- name or initials (46%)
- Sincerely (44%)
- Love (28%)
- Regards (22%)
*respondents were allowed to choose multiple answers.
- “Thanks” is the least annoying sign-off (only 3% dislike it), while 21% dislike “Peace”.
40% of people asked would like the emails they receive to be more informative than promotional
>Picture in email
- Two-thirds of surveyed people claim that they prefer emails consisting mostly of images.
- Emails that include some sort of graphics have a higher open rate (27%) and CTR (4.5%) than that of text-based emails (20% and 3%).
- 74% of users delete the message if it doesn’t open within 5 seconds (which is most likely to happen because of the size of the pictures in the email).
- 43% of recipients read the emails without turning the images on.
- Research shows that it’s best to keep the text to image ratio in emails at 4:1.
Data Source: HubSpot Campaign Monitor MailChimp Content Marketing Institute GetResponse wordstream lauro.media snov.io business2community Statista , atomicreach EmailToolTester
You really make it seem so easy along with your presentation however I to
find this matter to be really something that I feel I would
never understand. It seems too complicated and extremely broad for me.
I am taking a look ahead for your next put up,
I will attempt to get the cling of it!
Hey I am so delighted I found your blog, I really found you by error, while I was
researching on Digg for something else, Regardless I am here now
and would just like to say thank you for a marvelous post and a all round interesting
blog (I also love the theme/design), I don’t have time to
read through it all at the moment but I have saved
it and also added your RSS feeds, so when I have time I will be
back to read more, Please do keep up the fantastic work.